
Scott Wallsten and Corwin Rhyan
For the past five years we have collected data about the exhibitors at the annual NCTA Cable Show from its website. Each year we analyze trends in the industry through the categories used to classify the exhibitors. Key observations this year include:
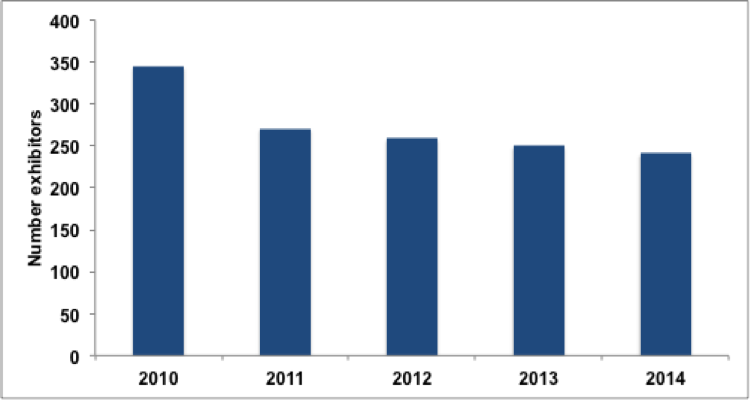
» The number of exhibitors continues to fall as it has in each of the past 4 years, from 345 in 2010 to 241 in 2014 (Figure 1).
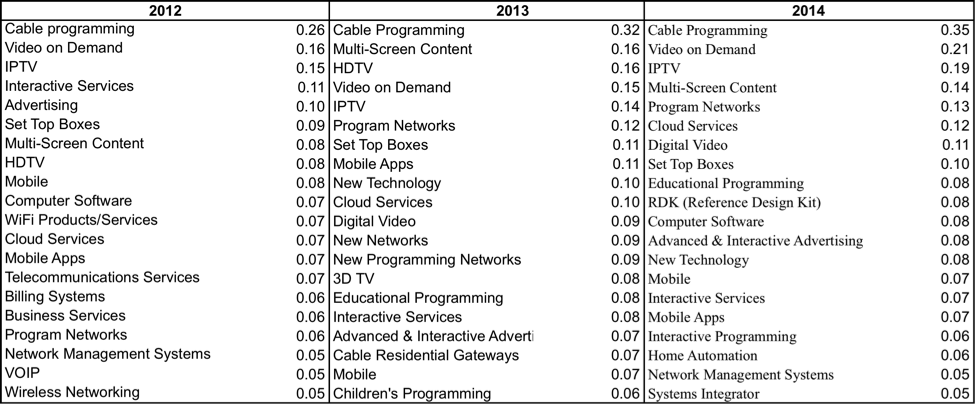
» Cable Programming, Video on Demand, IPTV, and Multi-Screen Content are the first, second, third, and fourth most popular in 2014. The top three increased in popularity since last year and Multi-Screen Content decreased slightly (Figure 2).
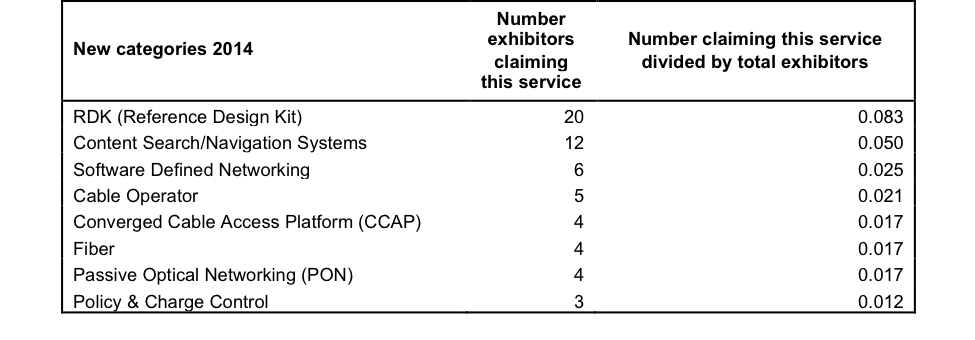
» New popular categories this year included RDK (Reference Design Kit)[1] and Content Search/Navigation Systems, with each having over 10 exhibitors in their first year. Fiber was absent in 2013, but has a few exhibitors in 2014 (Figure 4).
» Games, Consultants, and Research & Development show some of the largest year over year increases from 2013-2014 after Video on Demand, and IPTV (Figure 5).
» Four previously popular categories are absent from the 2014 show—HDTV, New Networks, tru2way, and VOIP. Other notable decliners include 3D TV and Mobile Apps. These highlight some difficulties in interpreting the results without other information. HDTV likely disappeared because it is so ubiquitous while 3D TV disappeared because it has generally been a market disappointment (Figure 7).
Number of Participants
The number of exhibitors in 2014 is down over 30% from 2010. After a large drop in 2011, the last 3 years have decreased at a more moderate 3% annual rate. The number of exhibitors is biased slightly upwards due to the fact that an exhibitor with multiple booth locations gets classified as two separate exhibitors in our data. However, the number of duplicates over the years is relatively small and consistent.
Figure 1: Number of Exhibitors 2010-2014
Hot Tech This Year
The Cable Show allows its exhibitors to define their companies by categorical labels which signal to potential customers the types of products and services offered. An exhibitor can select multiple categories for their products. In 2014, the average number of categories per exhibitor was 3.87, down slightly from 4.33 in 2013. In general, we expect exhibitors to classify their products as generally and widely as possible, with the hope of attracting interested attendees to their booths. In order to normalize the data for year over year comparisons, we divide the number of exhibitors in each category by the total number of exhibitors, yielding a percentage of exhibitors that select each category. The top 20 categories are listed below for the last 3 years, with Cable Programming defining over a third of all exhibitors this year.
Figure 2: Most Popular Categories 2012 – 2014
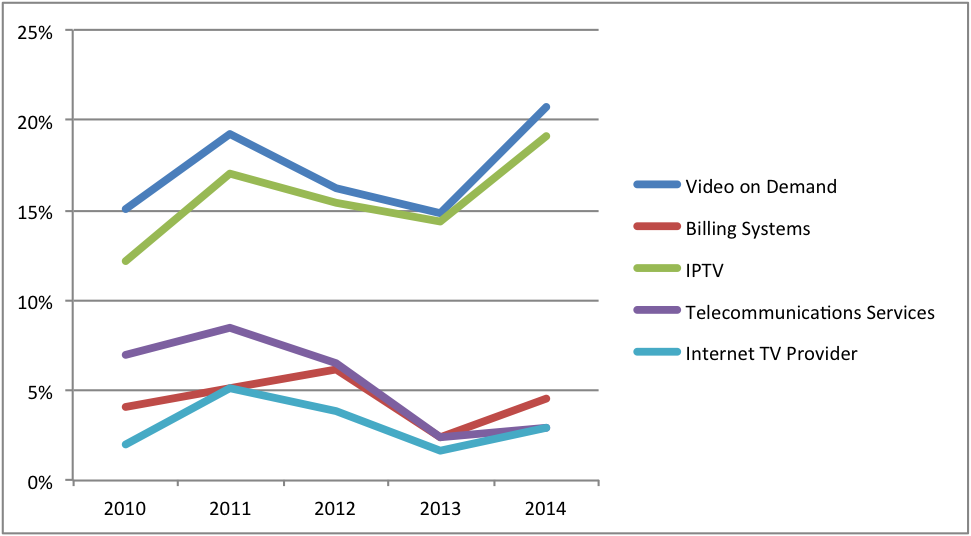
In graphical form below, we plot the trends of this year’s top 5 most popular categories over the past 5 years. While many of these categories have traditionally been near the top, most have grown over the past 5 years.
Figure 3: Top 5 Most Popular Categories
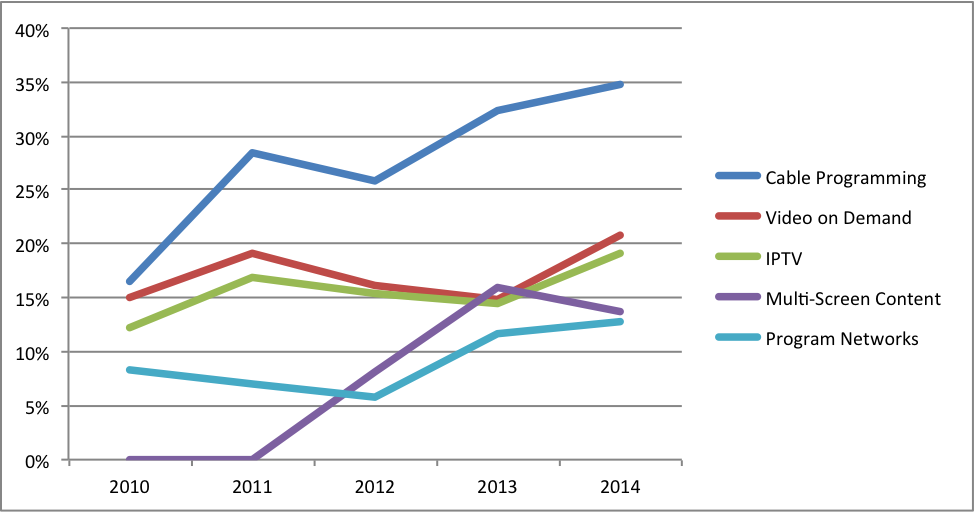
While we cannot rule out or in any particular hypothesis based on these data, it is worth noting that the large increase in programming-related exhibitors coincides with unprecedented increases in retransmission fees cable companies pay to programmers. It would be consistent with economic theory to see entry into this market as price increases.
What’s In and Out in 2014
The categories used to classify products and services change regularly. The new categories used in 2014 are listed in Figure 4. Some are similar to previous categories, such as Content Search/Navigation Services, which likely evolved from the separate category of Content Navigation, while others come with little previous background like RDK (Reference Design Kit).
Figure 4: New 2014 Categories
Many of the most popular 2013 categories continued to gain ground in 2014, with Video on Demand, IPTV, and Cable Programming showing strong gains. Games and Consultants showed a strong increase in representation as well. A complete list of the top gainers in 2014 is shown in Figure 5. Some gainers declined in 2013 but returned with stronger showings in 2014. This list includes categories such as Video on Demand, Billing, Internet TV Providers, IPTV, and Telecommunications Providers. A chart of these categories is shown in Figure 6.
Figure 5: Biggest 2013-2014 Gainers
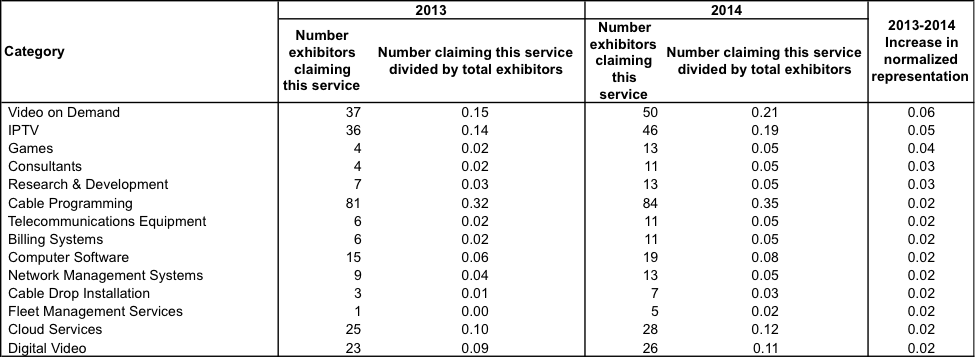
Figure 6: Categories that switched to growth in 2014
At the same time, some categories disappear between years. In 2014 some notable categories are no longer present.
The categories that declined in 2014 included many that disappeared from the list completely such as HDTV, New Networks, tru2way, and VOIP. Several possible theories could explain these disappearances: perhaps some categories became so ubiquitous as to be meaningless in the context of a trade show (e.g., HDTV or VOIP), show organizers decided to no longer include a category because it overlapped too heavily with other categories (e.g., was “New Network” the same as “Program Networks?”), or because it is no longer relevant?
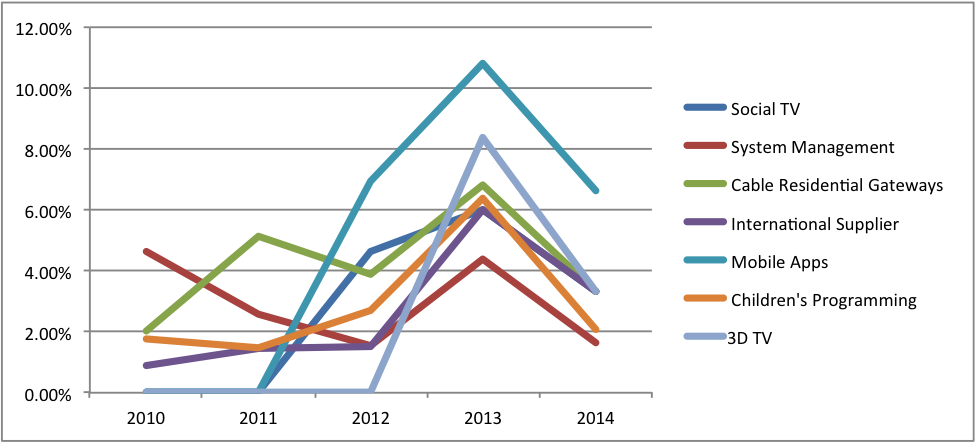
Other notable decliners include once “up and coming” technologies such as 3D TV, Mobile Apps, and Social TV. A decrease in a category is probably easier to interpret than an outright disappearance. 3D television, for example, has been a notable market disappointment and it is no surprise to see it disappearing from the show.
Figure 7: Biggest 2013-2014 Losers
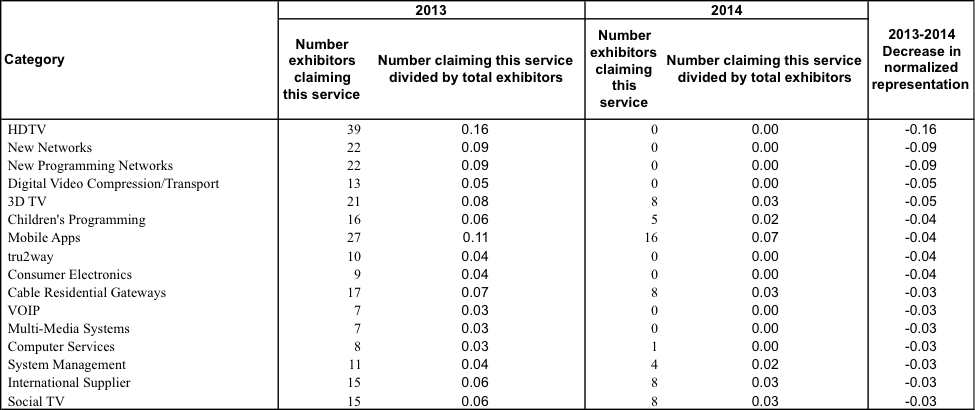
Figure 8: Categories that switched to decline in 2014
Conclusion
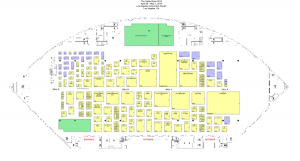
Using data from the Cable Show’s exhibitors is advantageous because it is representative of the actors in the industry who have real money on the line. In a tech world that loves to exaggerate the next “big thing”, using data directly from the industry members might help provide a better understanding of where the industry is headed. However, this data must be used with caution. First, the categories are self-reported by exhibitors, and while they have a clear incentive to accurately categorize their products and services, some might also see advantages in identifying with certain hyped industry technologies to attract customers. Secondly, the analysis weighs each exhibitor identically, which clearly isn’t accurate as some booths are massive and staffed by dozens of people while others are little more than a table and the company owner (Figure 9).
Despite these data shortcomings the data show a continued trend towards a cable industry more focused on its traditional roles as a television service provider, with programming, television, video, and networks topping our list in 2014, while the hyped technologies that were set to revolutionize the cable industry in 2012 and 2013 fell in 2014.
Figure 9: 2014 Cable Show Floor Plan
[1] According to www.rdkcentral.com, RDK is “a pre-integrated software bundle that provides a common framework for powering customer-premises equipment (CPE) from TV service providers, including set-top boxes, gateways, and converged devices.”